The
S&P 500 (ASX: SPY) is down (-15.91%) year-to-date as investors are contemplating when the bottom will come in. Simply put, the $317.90 is how low the SPY can go based on the rifle charts. The Nasdaq has fallen (-29%) from its highs and is clearly in bear market territory. The SPY is still in
correction territory and phase. A bear market occurs when the underlying asset falls (-20%) or more from its highs for at least 60 consecutive days.
Buy the dips works in bull markets. Buy the dips can work in bear markets only if you also sell the rips. In other words, the
market is not out of the woods and can continue to go lower after initial reversions. If dollar-cost-averaging is the
strategy, then its best to stick with indexes rather than individual stocks as evident by the numerous
meme stocks and
SPACs that may never see its highs again in this lifetime (or next).
Inflation
The latest Consumer Price Index (CPI) came in at 8.3%, which was a drop from the 8.5% peak, but still higher than the 8.1% estimates. The release caused a thousand-point rally in the Dow Jones, only to have it collapse for the next six trading sessions.
The Fed
It’s becoming more and more apparent that the Federal Reserve has been lagging in its actions and playing catch up ball. This is nothing new, they are always late to the game. The Fed is a reactive not proactive agency. The Fed still believes much of the inflation is transitory and perpetuated by the slingshot demand upon reopening that caused supply chain disruptions. It still believes that normalization will eventually come and still targets a 2% inflation rate, which is long ways to go from the current 8.3% rate. As much as the Fed wants a soft landing, the reality could be much harder to bear. Analysts are torn if the Fed should front load higher incremental rate hikes and get the pain over with or keep it steady through the end of the year. The Fed always being “laggard” opts to wait for the data. Rising interest rates will slow growth as assets value deflate including real estate. Mortgage rates literally doubled to 6% in less than a year and is starting to impact mortgage applications which is the lifeblood of buying pressure. What we know is that the Fed is not anywhere near done raising interest rates, which means asset prices have more downside. The question is when the Fed will slow down, take a break, or stop the rate hikes, which is when the market can truly get the okay to trend back up. Here are the near-term and longer-term trajectories for the SPY.
SPY Price Trajectories
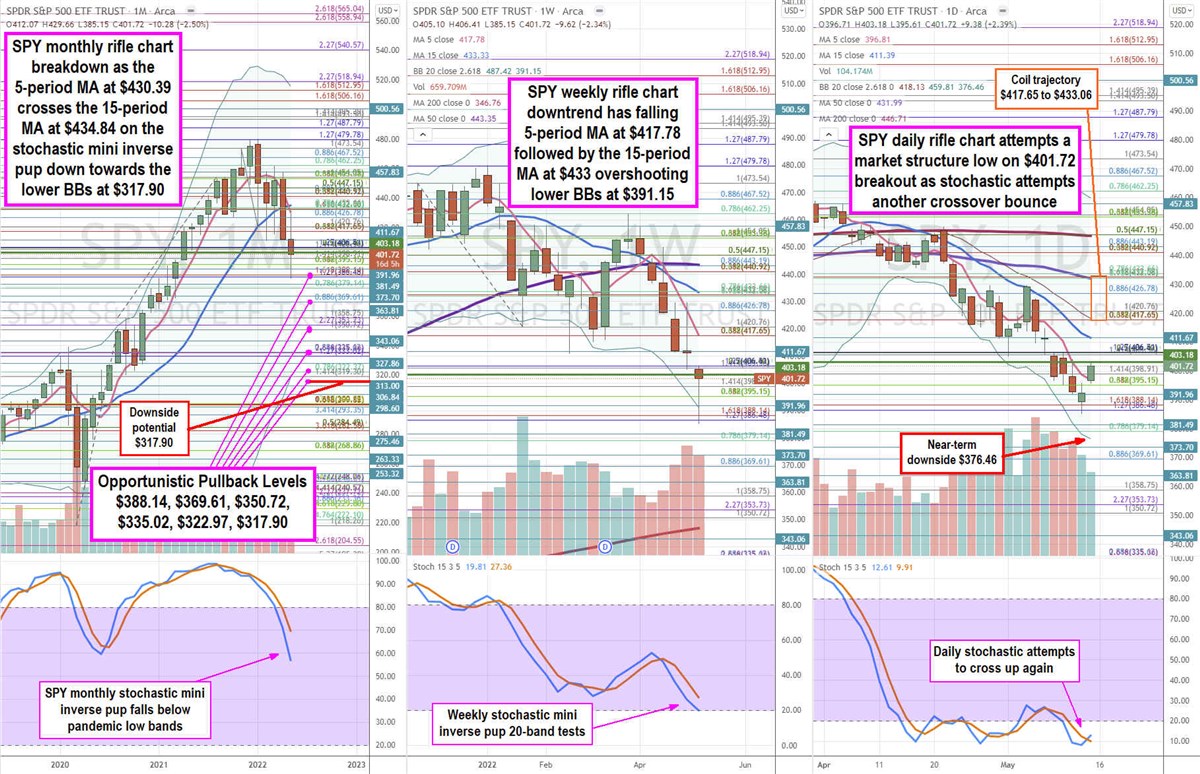
Using the rifle charts on monthly, weekly, and daily time frames provides a complete view of the SPY. The SPY hit a pandemic low of $218.26 on March 24, 2020, from a high of $337.34 on Feb. 19, 2020. The SPY proceeded to rally off the lows to a high of $479.98 on Jan. 4, 2022. Shares proceeded to collapse towards a low just below the $386.40 Fibonacci (fib) level before staging a rally and potential daily market structure low (MSL) buy trigger on a breakout through $401.72. The monthly rifle chart finally formed an official breakdown as the monthly 5-period moving average (MA) crossed over the 15-period MA at $434.84 as the monthly stochastic mini inverse pup falls through the 80-band towards the 60-band. Since the monthly is the largest time frame chart we use, the moving averages will seem extremely laggard. However, they are the strongest trend lines that come into play when shares near the moving average and Bollinger Band (BBs) bumpers. The monthly upper BBs sit at $515.65 and monthly lower BBs sit at $317.90. The worst case downside scenario would be a sell-off to the monthly lower BB at $317.90, which would also be a “back the truck up” buying opportunity. The weekly rifle chart has been in a downtrend with a falling 5-period MA resistance at $417.78 and 15-period MA resistance at $433.06. These provide the nominal reversion trajectory range if the bounce gains any follow through. The weekly lower BBs were overshot and acted as a slingshot level on the reversion at $391.15. The weekly upper BBs sit at $487.42. The daily rifle chart downtrend is stalling as the daily 5-period moving average flattens at the $396.81 level followed by the 15-period MA at $411.39. The daily 50-period MA resistance sits at $431.99 and 200-period MA at $446.71. The daily lower BBs sit at $376.06, which can be a near-term bottom level should shares fall back below the $386.40 support fib, If the daily stochastic crosses up through the 20-band, then reversion trajectories between the $417.65 to $433.06 range came into play with addition upside potential to the daily 200-period MA at $446.71. Patient investors seeking to scale into a position either in the SPY or utilizing the opportunistic pullback levels for specific stocks can watch for the $388.14 fib, $369.61 fib, $350.72 fib, $335.02 fib, $322.97 fib, and the $317.90 monthly lower BBs.